
November 15, 2019
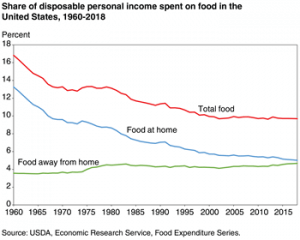 The average U.S. household spent 9.7% of disposable personal income on food in 2018, according to a report by the U.S. Department of Agriculture’s Economic Research Service (ERS). This percentage includes food consumed both at home and away from home.
ERS researchers note that the percentage has remained stable since the late 1990s and is the result of a long-term trend. In 1960, for example, the average household spent 16.8% of disposable income on food.
Between 2014 and 2018, the food price index increased 4.5% – a smaller increase than most other consumer expenses. Housing costs spiked by 10.8%, while medical charges were 11.4% higher.
Increased U.S. production of agricultural commodities and a strong U.S. dollar tempered retail food price inflation during this period, according to the ERS.
The report also indicates that the average figure on food spending includes a spectrum of household incomes. As incomes rise, households spend more money on food, but the expense represents a smaller overall budget share. Households with lower incomes devote larger percentages of annual income to food purchases.
The ERS report is posted at http://bit.ly/2Qp7z5c.